← back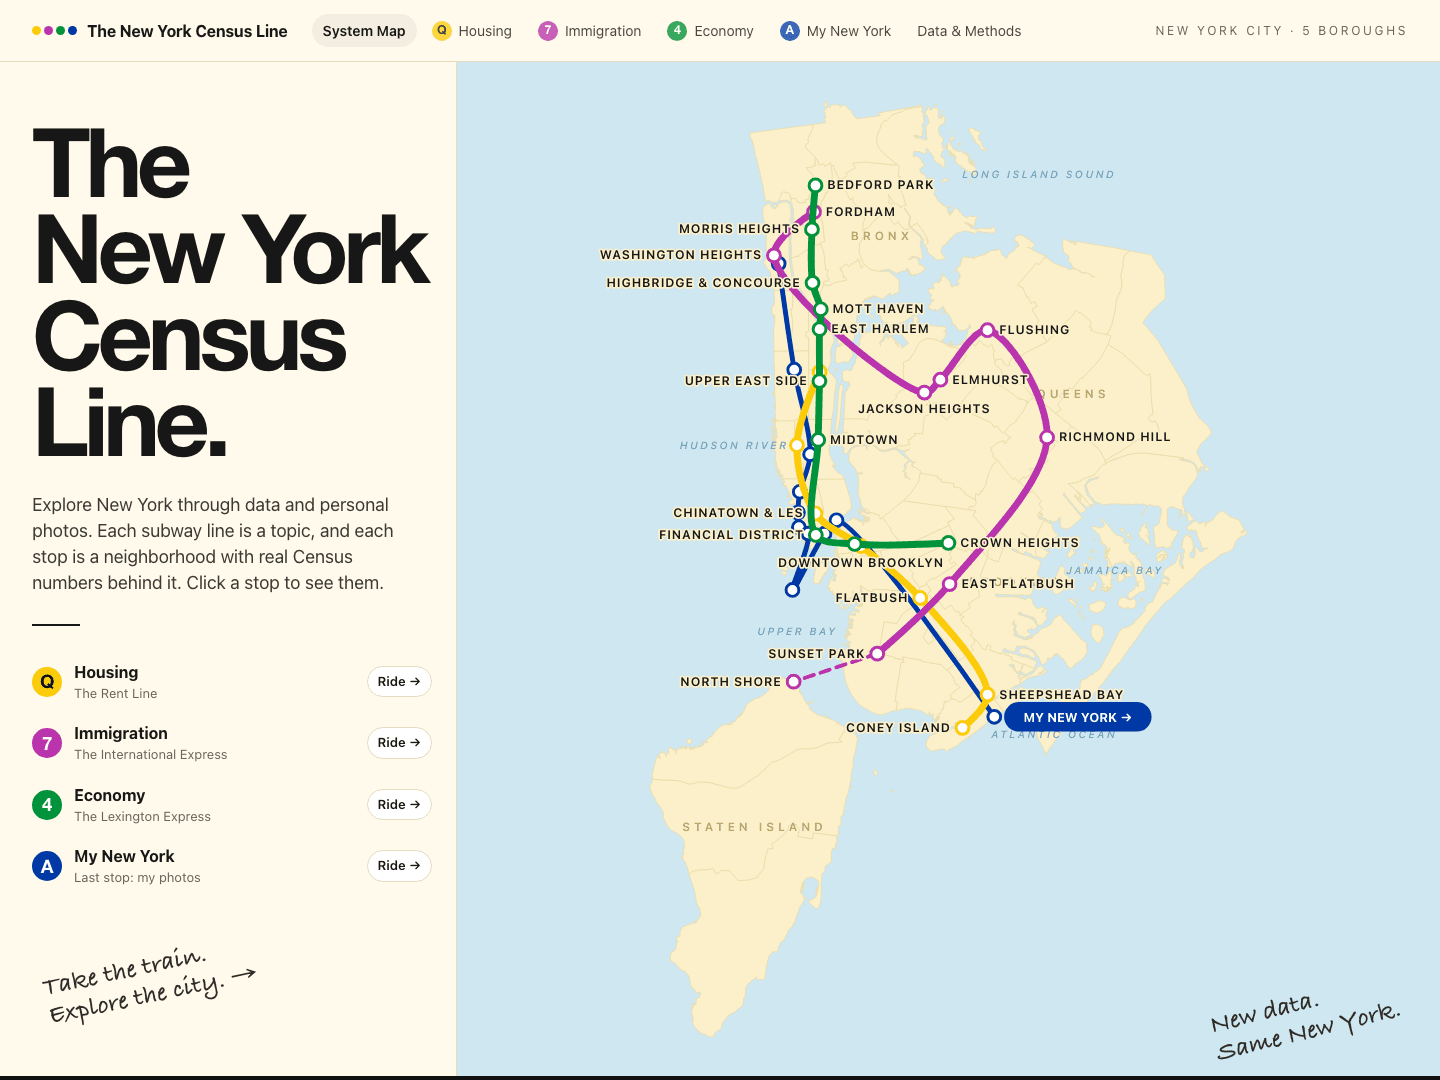
01Personal project · Data visualization
The New York Census Line
Census data × subway map × five boroughs
Exploring New York through data and personal photos. Each subway line is a topic, and each stop is a neighborhood with real Census numbers behind it.
What I built
- An interactive system map of the five boroughs where every stop opens that neighborhood's Census numbers
- Three data lines: Housing (the Rent Line), Immigration (the International Express) and Economy (the Lexington Express)
- A last stop, My New York, with my own photos of the city
- A citywide at-a-glance panel: residents, share born abroad, median rent, rent burden, median income and subway commuting
Technologies
Next.jsACS 2020–2024 5-year estimatesNYC Open DataBLS CPI-U